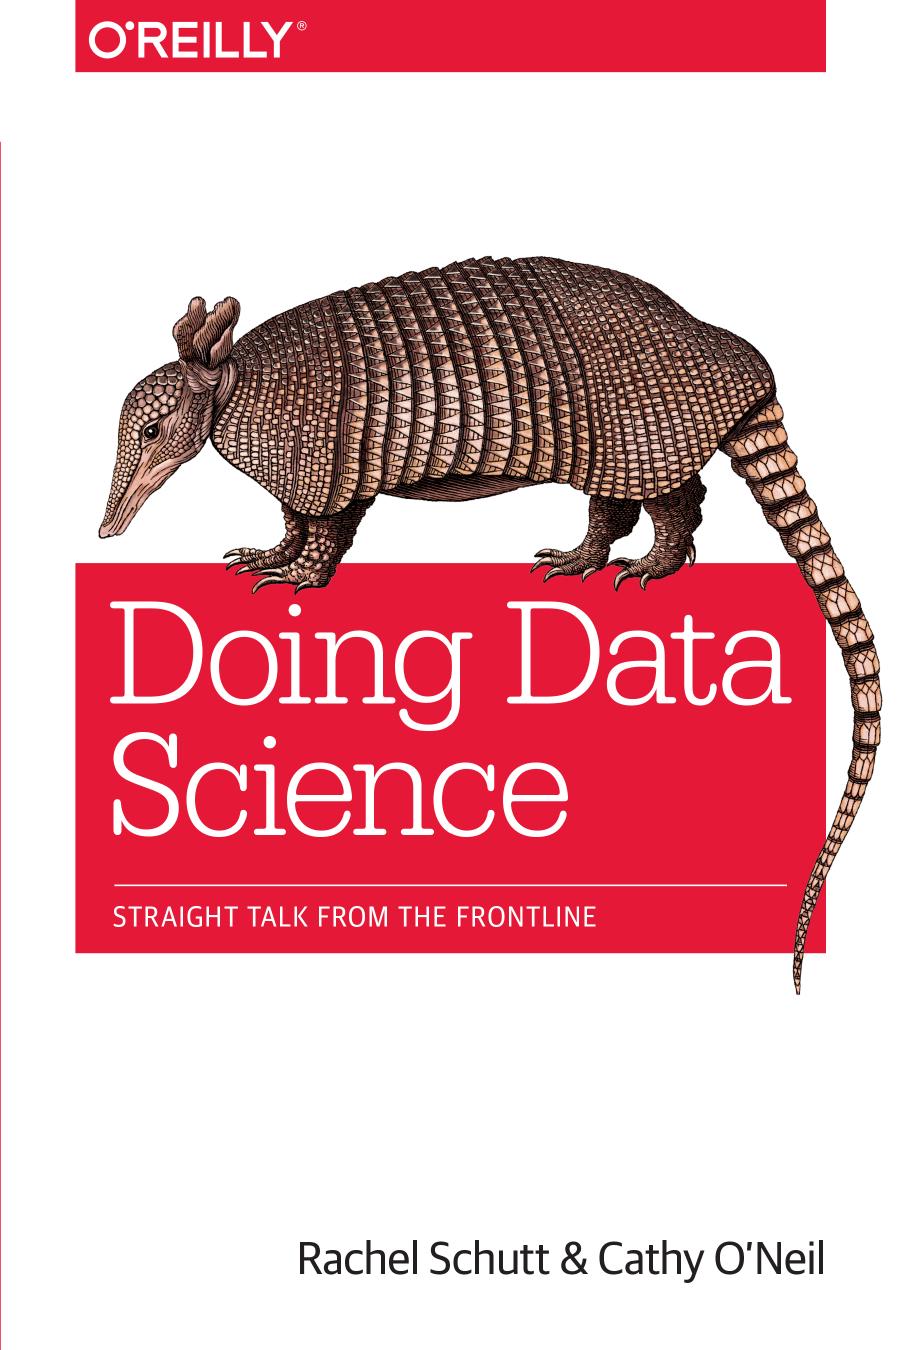
Doing Data Science Straight Talk from the Frontline 1st Edition by Cathy Neil, Rachel Schutt 1449358659 9781449358655
$70.00 Original price was: $70.00.$35.00Current price is: $35.00.
Instant download Doing Data Science Straight Talk from the Frontline after payment
Doing Data Science Straight Talk from the Frontline 1st Edition by Cathy Neil, Rachel Schutt – Ebook PDF Instant Download/Delivery: 1449358659, 9781449358655
Full download Doing Data Science Straight Talk from the Frontline 1st Edition after payment

Product details:
ISBN 10: 1449358659
ISBN 13: 9781449358655
Author: Cathy O’Neil; Rachel Schutt
Now that people are aware that data can make the difference in an election or a business model, data science as an occupation is gaining ground. But how can you get started working in a wide-ranging, interdisciplinary field that’s so clouded in hype? This insightful book, based on Columbia University’s Introduction to Data Science class, tells you what you need to know. In many of these chapter-long lectures, data scientists from companies such as Google, Microsoft, and eBay share new algorithms, methods, and models by presenting case studies and the code they use. If you’re familiar with linear algebra, probability, and statistics, and have programming experience, this book is an ideal introduction to data science. Topics include: Statistical inference, exploratory data analysis, and the data science process Algorithms Spam filters, Naive Bayes, and data wrangling Logistic regression Financial modeling Recommendation engines and causality Data visualization Social networks and data journalism Data engineering, MapReduce, Pregel, and Hadoop Doing Data Science is collaboration between course instructor Rachel Schutt, Senior VP of Data Science at News Corp, and data science consultant Cathy O’Neil, a senior data scientist at Johnson Research Labs, who attended and blogged about the course.
Doing Data Science Straight Talk from the Frontline 1st Table of contents:
1. Introduction: What Is Data Science? 1.1. Big Data and Data Science Hype
1.2. Getting Past the Hype
1.3. Why Now?
1.4. Datafication
1.5. The Current Landscape (with a Little History)
1.6. Data Science Jobs
1.7. A Data Science Profile
1.8. Thought Experiment: Meta-Definition
1.9. OK, So What Is a Data Scientist, Really?
1.10. In Academia
1.11. In Industry
2. Statistical Inference, Exploratory Data Analysis, and the Data Science Process
2.1. Statistical Thinking in the Age of Big Data
2.2. Statistical Inference
2.3. Populations and Samples
2.4. Populations and Samples of Big Data
2.5. Big Data Can Mean Big Assumptions
2.6. Modeling
2.7. Exploratory Data Analysis
2.8. Philosophy of Exploratory Data Analysis
2.9. Exercise: EDA
2.10. The Data Science Process
2.11. A Data Scientist’s Role in This Process
2.12. Thought Experiment: How Would You Simulate Chaos?
2.13. Case Study: RealDirect
2.14. How Does RealDirect Make Money?
2.15. Exercise: RealDirect Data Strategy
3. Algorithms
3.1. Machine Learning Algorithms
3.2. Three Basic Algorithms
3.3. Linear Regression
3.4. k-Nearest Neighbors (k-NN)
3.5. k-means
3.6. Exercise: Basic Machine Learning Algorithms
3.7. Solutions
3.8. Summing It All Up
3.9. Thought Experiment: Automated Statistician
4. Spam Filters, Naive Bayes, and Wrangling
4.1. Thought Experiment: Learning by Example
4.2. Why Won’t Linear Regression Work for Filtering Spam?
4.3. How About k-nearest Neighbors?
4.4. Naive Bayes
4.5. Bayes Law
4.6. A Spam Filter for Individual Words
4.7. A Spam Filter That Combines Words: Naive Bayes
4.8. Fancy It Up: Laplace Smoothing
4.9. Comparing Naive Bayes to k-NN
4.10. Sample Code in bash
4.11. Scraping the Web: APIs and Other Tools
4.12. Jake’s Exercise: Naive Bayes for Article Classification
4.13. Sample R Code for Dealing with the NYT API
5. Logistic Regression
5.1. Thought Experiments
5.2. Classifiers
5.3. Runtime
5.4. You
5.5. Interpretability
5.6. Scalability
5.7. M6D Logistic Regression Case Study
5.8. Click Models
5.9. The Underlying Math
5.10. Estimating α and β
5.11. Newton’s Method
5.12. Stochastic Gradient Descent
5.13. Implementation
5.14. Evaluation
5.15. Media 6 Degrees Exercise
5.16. Sample R Code
6. Time Stamps and Financial Modeling
6.1. Kyle Teague and GetGlue
6.2. Timestamps
6.3. Exploratory Data Analysis (EDA)
6.4. Metrics and New Variables or Features
6.5. What’s Next?
6.6. Cathy O’Neil
6.7. Thought Experiment
6.8. Financial Modeling
6.9. In-Sample, Out-of-Sample, and Causality
6.10. Preparing Financial Data
6.11. Log Returns
6.12. Example: The S&P Index
6.13. Working out a Volatility Measurement
6.14. Exponential Downweighting
6.15. The Financial Modeling Feedback Loop
6.16. Why Regression?
6.17. Adding Priors
6.18. A Baby Model
6.19. Exercise: GetGlue and Timestamped Event Data
6.20. Exercise: Financial Data
7. Extracting Meaning from Data
7.1. William Cukierski
7.2. Background: Data Science Competitions
7.3. Background: Crowdsourcing
7.4. The Kaggle Model
7.5. A Single Contestant
7.6. Their Customers
7.7. Thought Experiment: What Are the Ethical Implications of a Robo-Grader?
7.8. Feature Selection
7.9. Example: User Retention
7.10. Filters
7.11. Wrappers
7.12. Embedded Methods: Decision Trees
7.13. Entropy
7.14. The Decision Tree Algorithm
7.15. Handling Continuous Variables in Decision Trees
7.16. Random Forests
7.17. User Retention: Interpretability Versus Predictive Power
7.18. David Huffaker: Google’s Hybrid Approach to Social Research
7.19. Moving from Descriptive to Predictive
7.20. Social at Google
7.21. Privacy
7.22. Thought Experiment: What Is the Best Way to Decrease Concern and Increase Understanding and Control?
8. Recommendation Engines: Building a User-Facing Data Product at Scale
8.1. A Real-World Recommendation Engine
8.2. Nearest Neighbor Algorithm Review
8.3. Some Problems with Nearest Neighbors
8.4. Beyond Nearest Neighbor: Machine Learning Classification
8.5. The Dimensionality Problem
8.6. Singular Value Decomposition (SVD)
8.7. Important Properties of SVD
8.8. Principal Component Analysis (PCA)
8.9. Alternating Least Squares
8.10. Fix V and Update U
8.11. Last Thoughts on These Algorithms
8.12. Thought Experiment: Filter Bubbles
8.13. Exercise: Build Your Own Recommendation System
8.14. Sample Code in Python
9. Data Visualization and Fraud Detection
9.1. Data Visualization History
9.2. Gabriel Tarde
9.3. Mark’s Thought Experiment
9.4. What Is Data Science, Redux?
9.5. Processing
9.6. Franco Moretti
9.7. A Sample of Data Visualization Projects
9.8. Mark’s Data Visualization Projects
9.9. New York Times Lobby: Moveable Type
9.10. Project Cascade: Lives on a Screen
9.11. Cronkite Plaza
9.12. eBay Transactions and Books
9.13. Public Theater Shakespeare Machine
9.14. Goals of These Exhibits
9.15. Data Science and Risk
9.16. About Square
9.17. The Risk Challenge
9.18. The Trouble with Performance Estimation
9.19. Model Building Tips
9.20. Data Visualization at Square
9.21. Ian’s Thought Experiment
9.22. Data Visualization for the Rest of Us
9.23. Data Visualization Exercise
People also search for Doing Data Science Straight Talk from the Frontline 1st:
how do i add service to my straight talk phone
doing data science in r
is intro to data science hard
how much is data for straight talk


