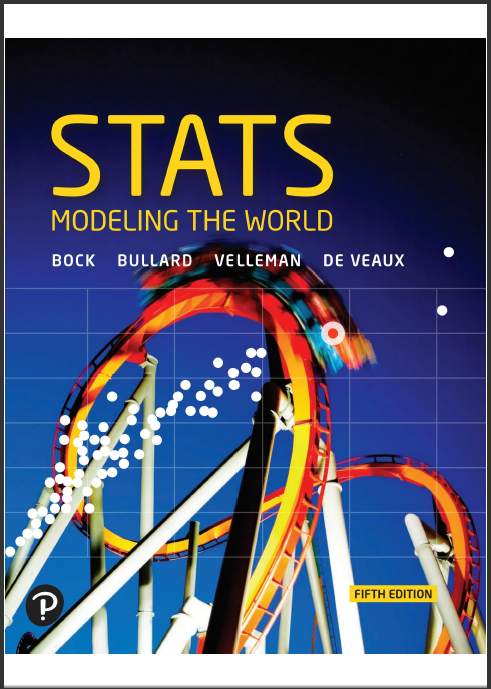
Solution manual for Stats Modeling the World 5th Edition by David Bock, Paul Velleman, Richard De Veaux, Floyd Bullard 0134687965 9780134687964
$70.00 Original price was: $70.00.$35.00Current price is: $35.00.
Instant download (Solution manual) Stats Modeling the World 5th Edition after payment
Solution manual for Stats Modeling the World 5th Edition by David E. Bock, Paul F. Velleman, Richard D. De Veaux, Floyd Bullard – Ebook PDF Instand Download/DeliveryISBN: 0134687965, 9780134687964
Full dowload Stats Modeling the World 5th Edition after payment

Product details:
ISBN-10 : 0134687965
ISBN-13 : 9780134687964
Author: David E. Bock, Paul F. Velleman, Richard D. De Veaux, Floyd Bullard
For courses in Introductory Statistics (algebra-based). Gets students thinking statistically from the start Stats: Modeling the World by Bock, Velleman, DeVeaux, and Bullard engages students by opening with practical data analysis and graphics. Chapters begin with new, motivating examples and follow through with analyses of the data; then, real-world examples provide a basis for sample problems and exercises. The authors’ colloquial, approachable writing style reads unlike any other statistics text. Their signature Think, Show, and Tell problem-solving method guides students through learning what we can find in data, why we find it interesting, and how to report it to others. Focused lessons are shorter than in most other texts, and are more manageable for both students and instructors. The 5th Edition extends the innovations of this acclaimed text, with important revisions and additions that support the teaching of Statistics and statistical thinking as it is practiced today. Also available with MyLab Statistics By combining trusted author content with digital tools and a flexible platform, MyLab Statistics personalizes the learning experience and improves results for each student. With MyLab Statistics and StatCrunch®, an integrated web-based statistical software program, students learn the skills they need to interact with data in the real world.
Stats Modeling the World 5th Table of contents:
Part I Exploring and Understanding Data
1 Stats Starts Here1
So, What Is (Are?) Statistics?
Statistics in a Word
But What Are Data?
Who and What
Question
Answer
How the Data Are Collected
More About Variables (What ?)
Identifiers
Categorical Variables
Quantitative Variables
Either/Or?
Recap
Question
Answer
Just Checking
To Enter Data
To Change a Datum
To Add More Data
To Delete A Datum
To Clear The Datalist
Lost A Datalist?
What Have We Learned?
Terms
Exercises
Just Checking Answers
2 Displaying and Describing Categorical Data
The Three Rules of Data Analysis
The Area Principle
Frequency Tables: Making Piles
Bar Charts
Question
Answer
Question
Answer
Pie Charts
Contingency Tables: Children and First-Class Ticket Holders First?
Question
Answer
Conditional Distributions
Recap
Question
Answer
Recap
Question
Answer
Just Checking
Question
Is the Difference Meaningful?
What Have We Learned?
Terms
Exercises
Just Checking Answers
3 Displaying and Summarizing Quantitative Data
Histograms
Stem-and-Leaf Displays
Dotplots
Think Before You Draw, Again
The Shape of a Distribution
Question
Answer
Just Checking
A Measure of Center: The Median
Spread: Home on the Range
Spread: The Interquartile Range
5-Number Summary
Boxplots
Question
Summarizing Symmetric Distributions: The Mean
Mean or Median?
Recap
Question
Answer
What About Spread? The Standard Deviation
Recap
Question
Answer
Just Checking
What to Tell about a Quantitative Variable
Recap
Question
Answer
Question
What Have We Learned?
Terms
Exercises
Just Checking Answers
4 Understanding and Comparing Distributions
The Big Picture
Comparing Groups with Histograms
Question
Answer
Comparing Groups with Boxplots
Question
Answer
Question
Just Checking
Outliers
Recap
Question
Answer
Timeplots: Order, Please!
Looking into the Future
*Re-expressing Data: A First Look
Re-expressing to Improve Symmetry
Re-expressing to Equalize Spread Across Groups
What Have We Learned?
Terms
Exercises
Just Checking Answers
5 The Standard Deviation as a Ruler and the Normal Model
The Standard Deviation as a Ruler
Standardizing with z-Scores
Question
Answer
Question
Answer
Just Checking
Shifting Data: Move the Center
Rescaling Data: Adjust the Scale
Recap
Question
Answer
Just Checking
Back to z-Scores
Question
When Is a z-Score BIG?
The 68–95–99.7 Rule
Question
Answer
Question
Answer
Just Checking
The First Three Rules for Working with Normal Models
Question
Finding Normal Percentiles
Example 1
Example 2
Question
From Percentiles to Scores: z in Reverse
Question
Question 1
Question 2
Question 3
*Are You Normal? Find Out with a Normal Probability Plot
The Truth About Assessing Normality
What Have We Learned?
Terms
Exercises
Just Checking Answers
Review of Part I
Exploring and Understanding Data
Quick Review
Review Exercises
Practice Exam
I. Multiple Choice
II. Free Response
Part II Exploring Relationships Between Variables
6 Scatterplots, Association, and Correlation
Looking at Scatterplots; Describing Associations
Question
Answer
Roles for Variables
Naming the Lists
Making the Scatterplot
Correlation
Correlation Conditions
Question
Answer
Just Checking
Question
Finding the Correlation
Correlation Properties
Recap
Question
Answer
Accidental Correlation
Warning: Correlation ≠ Causation
What Have We Learned?
Terms
Exercises
Just Checking Answers
7 Linear Regression
Residuals
Squared Residuals as a Measure of Fit
Correlation and the Line
How Big Can Predicted Values Get?
Just Checking
The Regression Line in Real Units
Question
Answer
Just Checking
Question
Residuals Revisited
Recap
Question
Answer
Just Checking
The Typical Residual Size (aka Standard Error)
Different Samples, Different Regression Lines
People also search for Stats Modeling the World 5th:
stats modeling the world 5th edition answers
stats modeling the world 5th edition answers pdf
stats modeling the world textbook answers
stats modeling the world 4th edition answers
stats modeling the world 3rd edition answers


